第三方库生态
构建stand-alone App
PyInstaller 用于将一个Python应用及其依赖打包到文件夹或可执行文件中,用户可以在不安装Python解释器以及任何模块的情况下运行打包后的应用程序。
可以使用PyInstaller来将PyWebIO应用打包成一个单独的可执行文件或文件夹:
创建pyinstaller spec (specification) 文件:
pyi-makespec <options> app.py
你需要将
app.py替换成你PyWebIO应用的文件名。编辑生成的spec文件,将其中
Analysis的data参数修改为:from pywebio.util import pyinstaller_datas a = Analysis( ... datas=pyinstaller_datas(), ...
使用spec文件来构建可执行文件:
pyinstaller app.spec
如果你希望生成一个单独的可执行文件而不是文件夹,你需要在第一步时传入 --onefile 选项。
更多PyInstaller用法请见: https://pyinstaller.readthedocs.io/en/stable/spec-files.html
数据可视化
PyWebIO支持使用第三方库进行数据可视化
Bokeh
Bokeh 是一个支持创建实时交互的数据可视化库。
在 PyWebIO 会话中调用 bokeh.io.output_notebook(notebook_type='pywebio') 来设置Bokeh输出到PyWebIO:
from bokeh.io import output_notebook
from bokeh.io import show

output_notebook(notebook_type='pywebio')
fig = figure(...)
...
show(fig)
相应demo见 bokeh demo
除了创建普通图表,Bokeh还可以通过启动Bokeh server来显示Bokeh app,Bokeh app支持向图表的添加按钮、输入框等交互组件,并向组件注册Python回调,从而创建可以与Python代码交互的图表。
在PyWebIO中,你也可以使用 bokeh.io.show() 来显示一个Bokeh App,代码示例见 bokeh_app.py。
注解
Bokeh App当前仅支持默认的Tornado后端
pyecharts
pyecharts 是一个使用Python创建 Echarts 可视化图表的库。
在 PyWebIO 中使用 put_html() 可以输出 pyecharts 库创建的图表:
# `chart` is pyecharts chart instance
pywebio.output.put_html(chart.render_notebook())
相应demo见 pyecharts demo
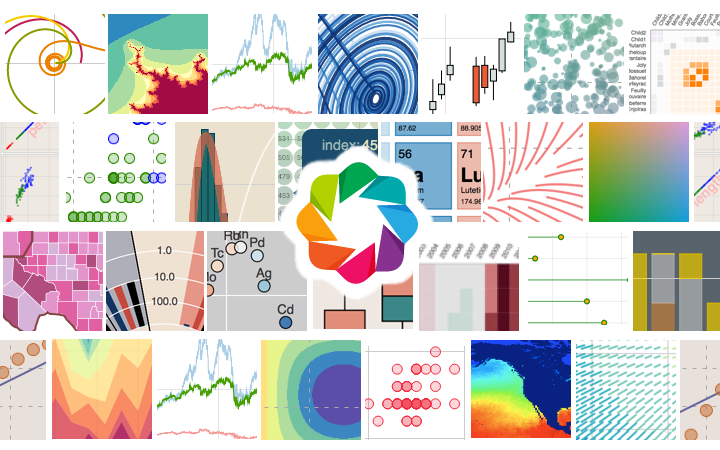
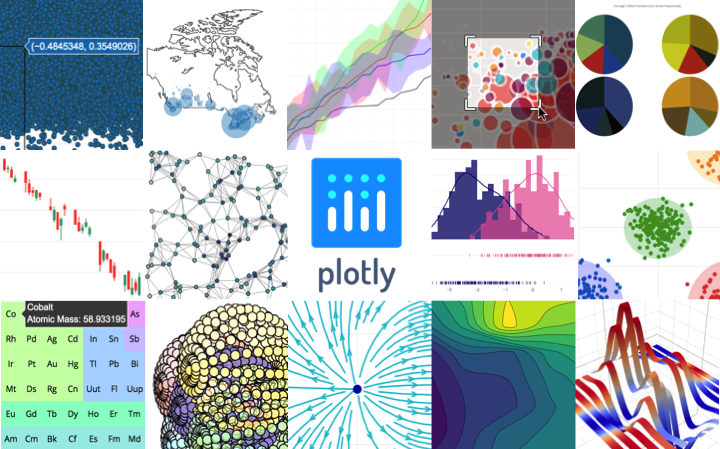
plotly
plotly.py 是一个非常流行的Python数据可视化库,可以生成高质量的交互式图表。
PyWebIO 支持输出使用 plotly 库创建的图表。使用方式为在PyWebIO会话中调用:
# `fig` is plotly chart instance
html = fig.to_html(include_plotlyjs="require", full_html=False)
pywebio.output.put_html(html)
相应demo见 plotly demo
pyg2plot
pyg2plot 是一个使用Python创建 G2Plot 可视化图表的库。
PyWebIO 支持输出使用 pyg2plot 库创建的图表。使用方式为在PyWebIO会话中调用:
# `chart` 为 pyg2plot 图表实例
pywebio.output.put_html(chart.render_notebook())
相应demo见 plotly demo
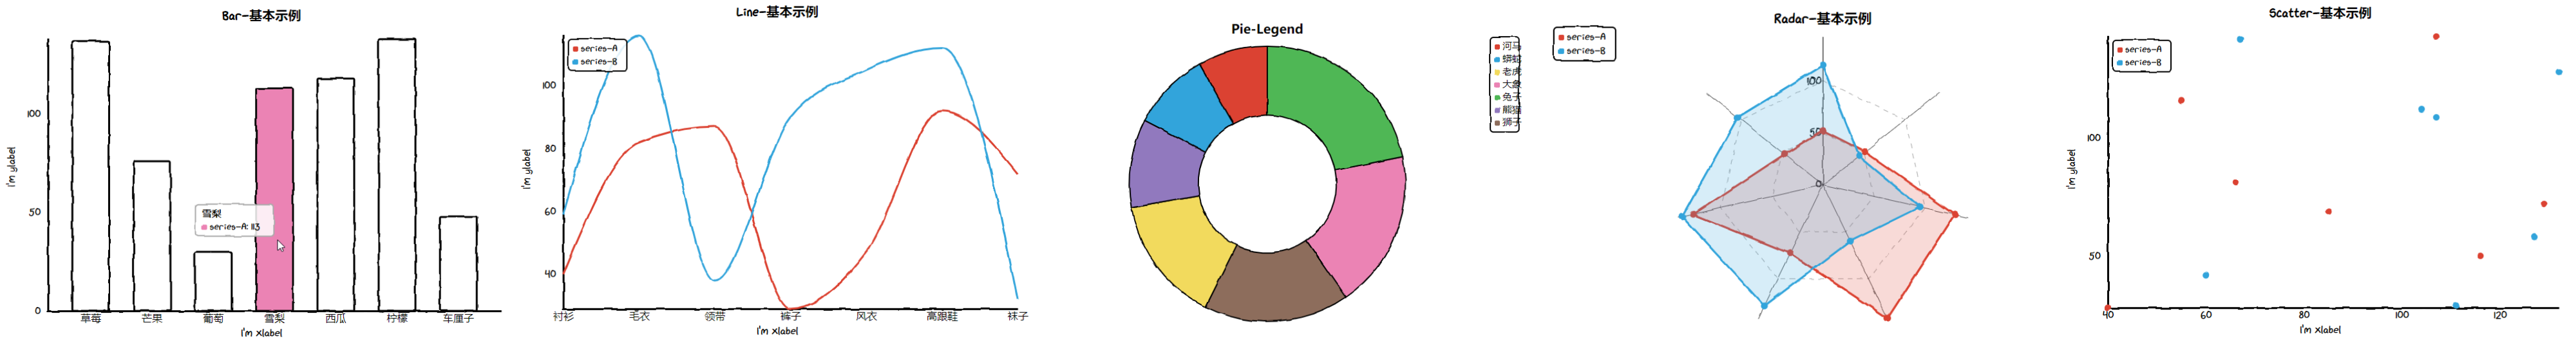
cutecharts.py
cutecharts.py 是一个可以创建具有卡通风格的可视化图表的python库。 底层使用了 chart.xkcd Javascript库。
在 PyWebIO 中使用 put_html() 可以输出 cutecharts.py 库创建的图表:
# `chart` is cutecharts chart instance
pywebio.output.put_html(chart.render_notebook())
相应demo见 cutecharts demo